The last month has seen China publish numerous points of disappointing data figures, many of which have fallen behind estimate, all of these data releases point towards a slowing in appetite almost certainly due to the spiralling potential trade war with the US which although suspended remains far from resolved.

Year on year Chinese industrial production
Table of Contents
Whilst industrial production output grew by 5.4% year on year according to November’s figures the data marks the slowest growth in industrial output for almost 3 years. The modest growth rate last matched by January to February 2016.
Markets had expected industrial production to reach 5.9% with the 5.4% falling short of market expectations. The economic numbers highlighting that the industrial output could be fizzing out and will inevitably put the real impetus on Beijing securing a deal with the US. China’s industrial sector has cooled in recent quarters as the government has attempted to limit shadow lending. Shadow lending is credit provided by financial brokers who aren’t subject to the regulation. This clampdown has seen certain areas of industry finding themselves lacking in terms of production financing and investment.
Chinese retail sales
The middle of the month also saw below par Chinese retail sales, potentially indicating a slow down in consumer confidence. Markets had anticipated 8.8% growth in November however sales grow shrank to 8.1% in November, falling further from October’s reading of 8.6%. The decline marked the weakest level of growth since 2003.
Beijing had anticipated a lift in consumer spending following tax cuts for individuals, therefore the recent retails sales figures have proved doubly disappointing. Novembers retail sales which cover both consumer and corporate spending totalled 3.52 trillion Yuan, down from 3.55 trillion Yuan in October.
Rather than heading to the high streets, it would appear that Chinese households are saving the extra income gained through the tax breaks. The government raised its tax threshold on personal income to 5000 Yuan in October anticipating that the extra income would be spent by consumers, although many may have saved for singles day bargains as yet an upturn in consumer spending hasn’t been seen.
Apple’s recent launch of the iPhone XR failed to boost telecom sales and auto sales in China were down roughly 10% year on year and totalled 345.9 Billion Yuan.
Industrial profits fall
The run of sub-par Chinese economic data was further compounded by the latest industrial profits number which fell 1.8% compared to November 2017. The year decline is the first in three years, the last being December 2015, with profit growth decelerating by 1.8% in November.
The fall in Chinese industrial profits compounded the rationale behind a slowdown in the Chinese economy. All of the data, therefore, pointed to a slowdown in the worlds second largest economy in the fourth quarter. The likely hood of further contraction in China’s GDP now appears a certainty, the last Chinese GDP figures attributing to a decade long low GDP growth of 6.5%.
Considered a very reliable indicator the Chinese industrial profit is the only data that measure the profitability of the industrial sector. Contributors towards the data include both private and state-owned businesses with annual revenue of 2.90 US Dollar.
China’s economic shortcomings have forced Beijing to implement a number of policies to underpin Chinese business and consumer sentiment and stabilise the economy’s growth.
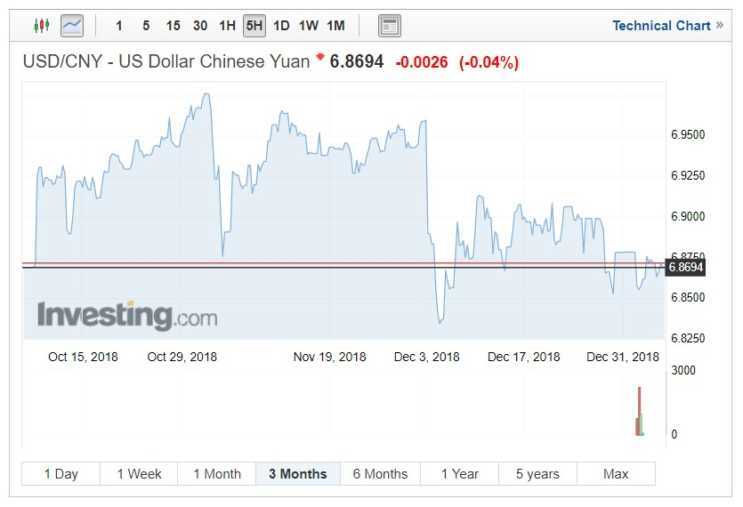
US Dollar and Chinese Yuan depreciation
The currency pair has whipsawed over the last quarter touching a low of 6.8346 in early December as the US political parties awaited the midterm election outcomes. Following this volatility has been caused by the Fed hiking interest rates and more downbeat rhetoric towards the economy. Great level of instability has been caused by Trump’s comments on the Fed chair Jerome Powell and the continual lack of progress with trade US and China Trade talks and the continuing government shutdown as Trump continues his crusade to build the wall.
Further instability will be seen in early January as the two super powers meet to thrash out the possibility of a trade deal. What is apparent is that neither party appears to be gaining an upper hand and with US consumer confidence dropping it might not be the outcome Trump had anticipated.